BiasHigher-timeframe context
 Contact
Boba Analysis Suite · MetaTrader 5 available
Recognize structure.
Trade with clarity.
An analysis tool that brings market structure, relevant price areas and higher-timeframe context together directly on your chart — for faster, clearer market analysis.
Explore MetaTrader 5 access
The Boba Analysis Suite is a product by Trade Ready Solutions.
BOBA / ANALYSIS VIEW
TradingView demo
1.0842
MARKET STRUCTUREFIB LEVELSHTF CONTEXT
01 — The Suite
One tool. One clear analysis process.
The Boba Analysis Suite organizes market structure, relevant price areas and higher-timeframe context directly on your chart. Available for MetaTrader 5 through MQL5 — an active rental includes additional TradingView access at no extra charge.
BOBA
Bias · Order Blocks · Breaks · Alignment
Order BlocksRelevant price areas
BreaksBOS & CHoCH
AlignmentStructure and Fibonacci in alignment
Understand market structure.
Read higher-timeframe context and relevant market structure faster, without losing the bigger picture as you move between views.
See relevant areas.
Bring Fibonacci areas and their associated order blocks together directly on your chart for a clear visual assessment.
Prepare your own decisions.
Use the information within a consistent analysis process — without automatic signals or prescribed trades.
03 — The Tools
Two perspectives. One shared analysis process.
Chart analysis and higher-timeframe context form the analytical foundation: detailed analysis on your working chart and a view of the broader market structure.
01CHART ANALYSIS
Your chart analysis tool
Boba Analysis Suite
Market structure, Fibonacci areas and order blocks come together in a clear chart view.
- Structural context directly on your chart
- Relevant retracement areas
- Fresh and mitigated order blocks
02MULTI-TIMEFRAME
The higher-timeframe perspective
HTF Context
Condenses higher-timeframe information into a compact overview without overloading your working chart.
- Higher-timeframe market structure
- Compact context dashboard
- A shared workflow with the Boba Analysis Suite
Live Chart
From a clean chart to a structured view.
These TradingView screenshots show how the two tools add information to the same market. Select a view to compare the original chart, HTF Context and the complete analysis view.
WITHOUT INDICATOR
The market before additional context.
The unchanged TradingView chart is our starting point. Price movement is visible, but you need to identify the relevant relationships yourself and put them into context across multiple timeframes.
Actual chart view · The display may vary depending on the market, period and individual settings.Bootcamp & Practice
See how the BOBA Analysis Suite works.
Explore the functions in the bootcamp, then see Chris Rath use the Suite in practice. Both videos are in German. On YouTube, enable captions and choose English auto-translation in the player settings if available.
New functions since these recordings: View Suite updates.
This German-language bootcamp demonstrates the TradingView version. Learn HTF context, Fibonacci structures, order blocks and alerts step by step.
Complete bootcamp · about 14 minutes · German audio
Playing the video loads YouTube and may transmit data, including your IP address, to Google. Privacy
Watch on YouTube ↗More practical examples and Suite updates will be added to our YouTube channel.
More BOBA videos on YouTube ↗News & Updates
New in the Suite.
New functions and practical guidance since the video recordings. Each update is labeled with its platform.
All twelve context Fibonaccis. Directly in your current chart.
Click the HTF Context dashboard to show or hide its individual Fibonacci structures in your current chart. Combine several structures or display just one — regardless of whether their timeframe is higher or lower than the chart you are viewing.
For example: display M5 Fibonaccis directly in an H4 chart, or H4 Fibonaccis in an M5 chart. Compare the selected structures without switching chart timeframes.
The HTF dashboard now stays in the foreground, so chart drawing lines no longer overlap it. Its values and clickable Fibonacci fields remain clearly visible.
View version details & usage
What is new in 1.16?
- Access all twelve Fibonaccis from HTF Context in whichever chart timeframe you are currently using.
- Individually show and hide the Fibonacci structures by clicking in the dashboard.
- Display multiple selected Fibonaccis at the same time, including structures from both higher and lower timeframes.
- HTF dashboard displayed in the foreground, without overlapping chart drawing lines.
How to use it
Open your preferred chart timeframe and click the Fibonacci you want to see in the HTF Context dashboard. Click additional Fibonaccis to combine them in the same chart. Click a selected Fibonacci again to hide it.
Installing the update
In MetaTrader 5, open Market → My Purchases and select Update for the BOBA Analysis Suite when version 1.16 is available. Sign in with the MQL5 account used for your purchase or rental. Updates can take up to 24 hours after publication to appear in the platform.
This release applies exclusively to the MetaTrader 5 version distributed through MQL5.
View product & version history on MQL5 ↗Trading Plan · English PDF
From context to entry preparation.
The Trading Plan for the Boba Analysis Suite brings higher-timeframe context, relevant order blocks and entry preparation together in a practical guide.
4 pages · Educational material · EnglishFor every stage of your development
Built for beginners. Made for experience.
The Suite was developed from a trading system based on Smart Money concepts. Its core information can also complement a wide range of trading approaches.
Understand the market visually.
Structure, zones and context are brought together visually. This helps you learn how they relate and develop a clear set of rules.
Reduce time spent on analysis.
Recurring chart markings and context information are available sooner, leaving more time to assess, prepare and execute your own plan.
Put existing setups into clearer context.
Market structure, Fibonacci areas, order blocks and higher-timeframe context can complement many strategies, helping you assess entry areas and your own risk-to-reward ratio more thoroughly.
04 — The Workflow
From the market picture to structured preparation.
- 01Assess context
Read the broader market before evaluating the details.
- 02Focus on structure
Identify active areas, swings and relevant zones on your working chart.
- 03Prepare your own decision
Use your analysis as the foundation for your personal trading plan.
Developed for flexible chart analysis
FuturesForexIndicesMetalsCryptoStocks
The actual display depends on the market, data feed, liquidity and selected timeframe. 
05 — Trade Ready Solutions
Analysis tools for a clear trading process.
Trade Ready Solutions develops structured analysis tools and combines them with practical trading education. The Boba Analysis Suite is the platform's first indicator solution.
06 — Why This Approach?
Experience over promises.
Our approach focuses on learning trading as a demanding profession: with structure, realistic expectations and a long-term perspective, rather than quick money or a staged trader lifestyle.
Experience gained firsthand.
Chris knows the highs, lows, doubts and learning curves of a trading career firsthand. His work is grounded in that experience rather than a theoretical success story.
Close to real challenges every day.
Working with many students repeatedly reveals where rules, market understanding, discipline or emotions become obstacles. The indicators and education are designed to address these practical challenges.
A reliable process over quick profits.
The goal is a clear trading process that you can apply independently, review and improve over time, rather than a get-rich-quick system.
No hype.No staged lifestyle.No promises of profit.Structure, experience and honest work.

FOUNDER / TRADER / EDUCATORChris Rath
07 — About the Founder
A clearer path, built through experience.
Chris Rath has been a full-time trader and trading coach for several years. Trade Ready Solutions grew out of his own development and his daily work with traders seeking greater structure and consistency.
Many challenges stem from unclear rules, psychological factors such as greed or fear of loss, and the difficulty of bringing multiple chart observations together. The Boba Analysis Suite turns this process into a clear, visual workflow.
Market structure, relevant price areas and higher-timeframe context become easier to read. This is particularly valuable for traders developing their skills alongside work and everyday commitments.
“My goal was never to make decisions for anyone. I wanted to make it easier to follow a clear process consistently.”
His journey led from prop trading toward a stronger focus on transparent execution, liquidity and a sustainable trading environment.
08 — The Value
Less searching. More structure. Clearer decisions.
The Boba Analysis Suite supports your decision-making by helping you work from a better-structured foundation.
A clear analysis process directly on your chart.
- Boba Analysis Suite for MetaTrader 5 — now on MQL5
- Market structure, Fibonacci areas and order blocks in view
- Structured presentation of relevant market information
- Less manual searching on your chart
- A consistent process across markets and timeframes
- Product support via support@tradereadysolutions.com
Uncertainty costs more than time.
Overlooked market structure, misinterpreted areas or rushed decisions can cost considerably more than access to the tool.
Even one poorly prepared trade can cost more than access to the Boba Analysis Suite.METATRADER 5 · AVAILABLE NOW
Your analysis tool for MT5.
The Boba Analysis Suite is now available for MetaTrader 5 on the MQL5 Market. Visit the product page for features, pricing and available license options.
AVAILABLE ON MQL5
View on MQL5 Purchase and installation take place through the MQL5 Market. The prices, product information and buyer terms displayed there apply.MetaTrader 5
Pricing and license options on the product pageTradingView access included at no extra charge
With an active MQL5 rental: use the BOBA Analysis Suite and HTF Context on TradingView too. Request manual activation after renting.
Already rented? Request access →Included with an active MQL5 rental
Your additional TradingView access.
When you rent the BOBA Analysis Suite through MQL5, access to the BOBA Analysis Suite and BOBA HTF Context on TradingView is included at no extra charge for the active rental period.
- Complete your rental through MQL5.
- Enter your details below and send the prepared email.
- We verify your active rental and manually activate your TradingView username.
The access is included; activation is not automatic. Your own TradingView account is required. A TradingView platform subscription or market data plan is not included.
09 — Contact & Support
Questions before you decide?
Use the contact form to get in touch with Trade Ready Solutions.
FOR SUBSCRIBERS
Product support by email.
Active subscribers can contact product support at support@tradereadysolutions.com.
Free Trading Journal
Your trades become valuable when you learn from them.
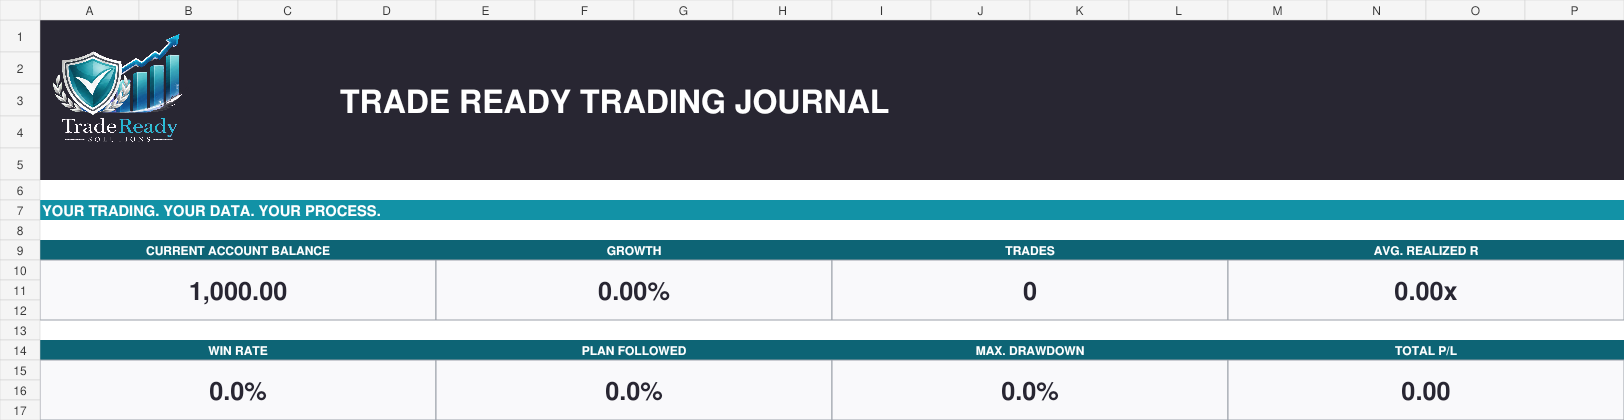
The Trade Ready Trading Journal organizes results, rule adherence and account performance. Enter your key data and the main metrics are calculated automatically.
- Automatic calculation of profit, loss and realized R
- Dashboard for account balance, growth, win rate and drawdown
- Record rule violations and price behavior after your exit
- Use your own copy in Google Sheets
TRADE READY / JOURNALFREE
GOOGLE SHEETSFREE ONLINE TEMPLATE